
You've published a dozen blog posts, your social channels are active, and traffic is trickling in. But here's the nagging question every marketer faces: is any of it actually working? If you're struggling to connect your content efforts to tangible business results, you're not alone. The common pain point isn't a lack of data; it's the overwhelming noise of vanity metrics like page views and social likes that don't tell the full story. This guide will show you how to measure content performance effectively, transforming your data from a confusing spreadsheet into a clear narrative of revenue, leads, and business growth. Let's move beyond guesswork and start proving your content's real ROI.
Why Your Current Content Measurement Might Be Failing
Many digital marketers and content creators feel like they're stuck on a content treadmill—constantly producing but struggling to prove their work's value. The problem isn't the effort; it's the focus. Chasing high traffic numbers without understanding the why behind them is a fast track to burnout and makes it incredibly difficult to justify your budget. True success in content marketing comes from a system that ties every piece of content back to a tangible business result. This means digging deeper than your basic dashboard and asking smarter questions:
- Which articles are genuinely influencing a customer's decision to buy?
- What topics are driving qualified leads that the sales team loves?
- Is our content building real authority and trust in our niche?
Answering these questions allows you to make data-driven decisions and finally demonstrate the true ROI of your content strategy, shifting from being a cost center to a predictable growth engine.
Step 1: Align Your Content with Business Goals
Before you even think about opening Google Analytics, let's talk about what "success" actually means. Effective measurement doesn't start with data; it starts with a clear line connecting every single blog post, video, and social update back to a bigger business goal.
Stop chasing traffic for traffic's sake. The real game is tying your content directly to what the C-suite cares about. Are you trying to generate more sales-ready leads? Boost customer lifetime value? Or maybe you're looking to become the undisputed authority in your niche. For a SaaS company, blog views are just vanity metrics; the number that really matters is how many of those readers sign up for a free trial. For an e-commerce brand, it's about which articles are actually driving purchases, not just clicks. Getting this mindset right is the first, most critical step in figuring out how to measure content performance in a way that truly matters.
From Vague Goals to Concrete KPIs
Once you know your North Star—that big business objective—you can work backward to pick the right Key Performance Indicators (KPIs). KPIs are your on-the-ground metrics that tell you if you're actually moving in the right direction. They take a fluffy goal like "increase brand awareness" and turn it into a hard target like "grow branded search traffic by 20% this quarter." This isn't just about collecting data; it's about telling a story with it.
Let's ground this in a practical table that shows how different goals translate into specific metrics.
| Content Goal | Primary KPIs | Secondary KPIs |
|---|---|---|
| Increase Brand Awareness | Branded Search Volume, Social Media Reach | Social Mentions, Direct Traffic |
| Generate Leads | Conversion Rate, MQLs Generated | Organic Traffic, Time on Page |
| Drive Sales | Revenue from Content, Assisted Conversions | Click-Through Rate (CTR) on CTAs |
| Build Authority | Backlinks Acquired, Top 3 Keyword Rankings | Organic Impressions, Referral Traffic |
| Improve Customer Retention | Repeat Visitor Rate, Page Views per Session | User Comments, Social Shares |
This framework ensures your measurement strategy is always aligned with what truly matters for business growth. For more ideas on connecting your strategy to real results, check out our guide on using AI for marketing.
Step 2: Build Your Content Analytics Tech Stack
Once your goals are locked in, it’s time to pick your tools. This isn't about hoarding software subscriptions; it's about building a connected system that gives you the full story of your content's journey. A smart tech stack is what takes you from guesswork to data-backed decisions.
The bedrock of any solid stack is a powerful analytics platform. For most, that means getting comfortable with Google Analytics 4 (GA4). Forget just looking at page views. Your first move should be setting up conversion events that actually mean something to your business—think newsletter sign-ups, "request a demo" clicks, or a specific download. These events are what turn raw traffic data into tangible business results.
Uncover User Intent and Connect to Revenue
Next, you absolutely need to plug in Google Search Console. While GA4 shows you what people do on your website, Search Console tells you how they found you in the first place. It’s a goldmine for understanding user intent. You might find a blog post that ranks for a high-volume keyword and pulls in tons of traffic, but nobody converts. That’s a classic sign of a mismatch between what people are looking for and what your content is actually delivering.
To get the full picture, from first click to final sale, you have to connect your content efforts to your CRM. Whether you’re using HubSpot or Salesforce, integrating it with your analytics allows you to trace the entire customer journey. This is closed-loop reporting, and it's the holy grail of proving ROI. It finally answers the million-dollar question: "How much actual revenue did our content generate?" This holistic view elevates your analytics from a simple report into a powerful business case for your content strategy. If you're looking to explore more tech that can support this process, check out some of the best AI tools for content creation that often integrate with these analytics platforms.
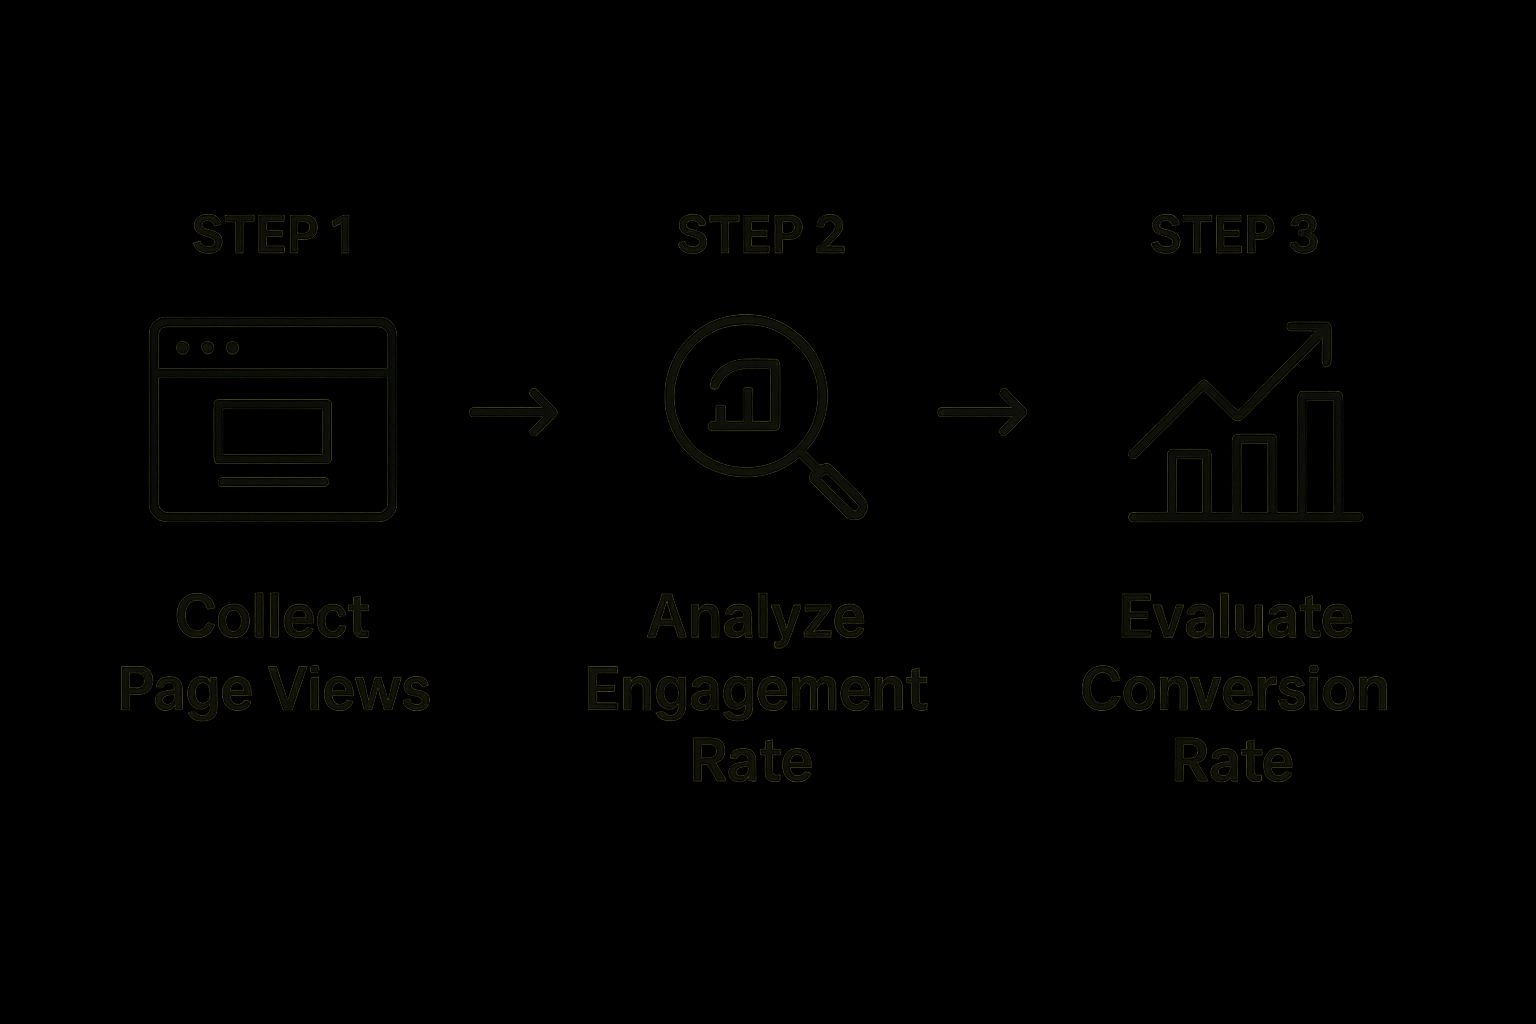
This minimalist flow chart really breaks down the core stages of content measurement, from grabbing the initial data all the way to evaluating the final conversion.
Step 3: Focus on Metrics That Tell the Full Story
You have your goals and tools ready. Now it's time to zero in on the numbers that actually matter. Learning how to measure content performance isn't about chasing vanity stats like page views. We need to dig deeper to uncover the real story of how people are engaging with your work.
Beyond Time on Page: True Engagement Signals
Let's be honest, the classic "Time on Page" metric can be a mirage. Someone could have your article open in a background tab for ten minutes, but that doesn't mean they were engaged. Google Analytics 4 introduced a much smarter alternative: Engaged Sessions. An engaged session is a visit that lasts longer than ten seconds, triggers a conversion event, or involves at least two pageviews. It filters out noise from accidental clicks and instant bounces, giving you a more honest look at genuine audience interest.
Another insightful metric is Scroll Depth. This tells you exactly how far down the page your readers are actually getting.
- Are most people bailing after the first paragraph? Your intro might be weak.
- Are they consistently making it 75% of the way down but ignoring your CTA? Your offer might not be compelling enough.
By analyzing scroll depth, you can pinpoint friction points and optimize your content's structure for a better reader experience. For more on this, check out our advanced SEO copywriting tips.
Distinguishing Between Micro and Macro Conversions
Not all conversions are the same. A macro-conversion is the big win—your primary business goal, like a product purchase or a demo request. But the journey to that finish line is paved with smaller steps called micro-conversions. These are lower-commitment actions that show interest and move someone further down your funnel, such as:
- Downloading a PDF guide or whitepaper
- Signing up for your email newsletter
- Watching an embedded video to completion
- Clicking a link to a related case study
Tracking both is non-negotiable. Micro-conversions prove that your top-of-funnel content is building trust, while macro-conversions prove your bottom-of-funnel content is closing the deal. Looking ahead to 2025, this blend of traffic, engagement, and conversion data remains the gold standard. Discover more insights on these essential metrics at Project-aeon.com.
👉 Try MediaWorkbench.ai for free – schedule your posts and generate AI content in one place!
Step 4: Turn Your Data into Smarter Decisions

All this data is just noise until you do something with it. This is where your insights become a real competitive advantage. You stop just reporting on what happened last month and start shaping what happens next, shifting your content strategy from reactive to proactive.
The High Traffic, Low Conversions Playbook
We’ve all seen it: a blog post that's crushing it in traffic but brings in zero leads. You won the SEO battle but are losing the business war. Before scrapping the article, it's time to play detective. The first thing to check is a user intent mismatch. Is the keyword driving traffic purely informational ("what is content marketing") while your call-to-action is transactional ("Buy Our Software")? Here’s a quick diagnostic checklist:
- Review the CTA: Is it buried or generic? Try making it more visible and super relevant to the article's topic.
- Analyze Scroll Depth: If 80% of your readers never see your CTA, the problem isn't the offer—it's the engagement.
- Check On-Page Signals: Look at metrics like bounce rate and engaged sessions. A high bounce rate is a red flag that your content isn't delivering on its promise.
Doubling Down on What Works
Fixing what's broken is only half the job; you also have to amplify what’s already working. Imagine you discover a small cluster of articles around one niche topic is bringing in 70% of your demo requests. That’s the market telling you what it wants. This is your signal to build a "topic pillar" around that subject, aiming to completely own that conversation. This strategy creates a powerful feedback loop: you measure, you analyze, you optimize, and you repeat. Automating this process is key, a concept we dive into in our guide to marketing automation best practices. This move toward deeper engagement metrics is becoming the new standard. In fact, industry analysis for 2025 shows a clear shift away from raw page views toward metrics like 'engaged sessions.' You can learn more about these priority KPIs on wearecsg.com.
Put Your Data to Work and Prove Your Content's Value
Measuring content performance isn't just another task on your to-do list; it's the core discipline that separates guessing from growing. By defining clear goals, using the right tools, and focusing on the metrics that link directly to business outcomes, you can finally prove the undeniable value your content brings to the table. This process transforms your content from a simple line item on a budget into a predictable, revenue-generating machine. When you're ready to streamline this entire workflow—from creation to analysis—a unified platform can make all the difference.
Ready to transform your data into a powerful content strategy? MediaWorkbench.ai provides the tools you need to create, analyze, and optimize your content all in one place. Start your free trial today and see the difference.